Inciteful currently consists of two tools. Paper Discovery and the Literature Connector. We’ll quickly go through how to use each here.
Paper Discovery
The real power behind Inciteful’s Paper Discovery tool is it’s ability to craft a graph based on your specific topic. There are a variety of ways in which to do that, which you can view on on the use cases page but here we will just go through a simple search process which you can follow along with or do your own search in parallel.
1) Start with a Paper
The easiest way to get started is by having a paper that covers a topic in which you are interested. You can either use the search box to type in the title or enter the DOI of the paper if you can’t find it through the search. For this example we will attempt to find the latest papers about methods of measuring segregation. We will use the following as the seed paper but you can use whatever you’d like:
“Planning Dissonance” and the Bases for Stably Diverse Neighborhoods: The Case of South Seattle
2) Explore the Results
At the top of the page we have information about the seed paper such as the title, authors, journal it was published in, etc. If they are available we also include links to the open access version of the article as well as the abstract. In addition to those we have basic stats about how many papers are citing this paper, how many papers the seed paper cites, an open access link if applicable, as well as some information about the graph.
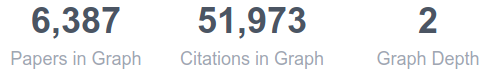
In this instance, it is a depth 2 graph, with 6,387 papers and 51,973 citations. To better understand what this means in the context of Inciteful head over to Graphs Explained.
Important Papers
We’ll skip past the Filters section and head down to the tables. The first table covers the Most Important papers, as measured by the PageRank algorithm. PageRank goes beyond simple citation counts and it values papers which are cited by other important papers, so you don’t need to have a lot of citations to be important, just be cited by important papers.
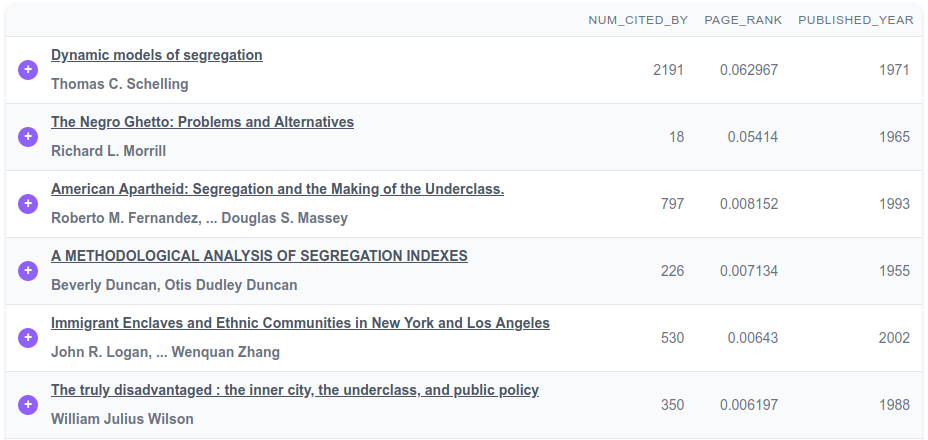
Given the nature of academic literature and how it takes time to build up citations, these papers tend to be the older papers in the graph. They typically represent the seminal papers in the field.
You can also click on any of the paper titles to get more information about them, similar to what is presented at the top of the current page.
Similar Papers
This section uses a link prediction algorithm to show you the most similar papers based on who these papers cite. If the seed paper cites many of the same papers that another paper does, then they are considered similar.
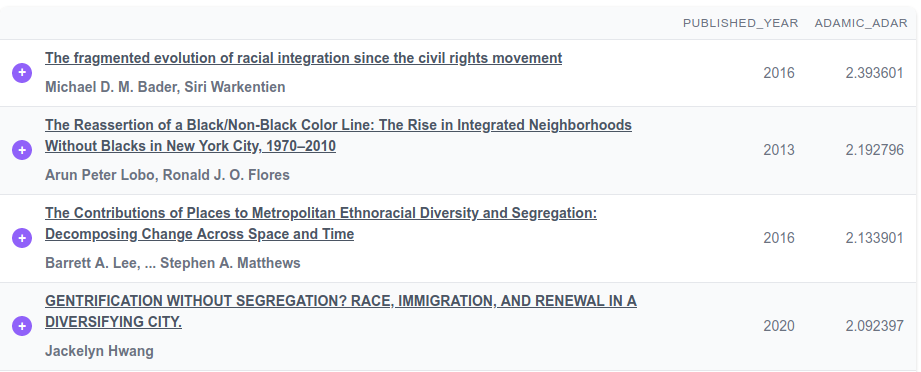
The effect of similar papers is the inverse of important papers. Since papers which are published after the seed paper have a better chance of citing the same papers, these papers tend to be more recent papers in the field.
Other Data
Under the Similar Papers section we have the Other Data section. This section is used to highlight other interesting information about the graph. Such as most important authors, institutions, and journals. It helps to get an idea of where the work in this space is being done, by whom, and in what journals.
Filters
Coming back to the Filter section, you can use these fields to filter the papers in the tables we just reviewed. You can filter by keyword (view an in depth explanation of the query syntax), distance, and year. These are especially helpful to zero in on the types papers you are looking for when the current graph is large.
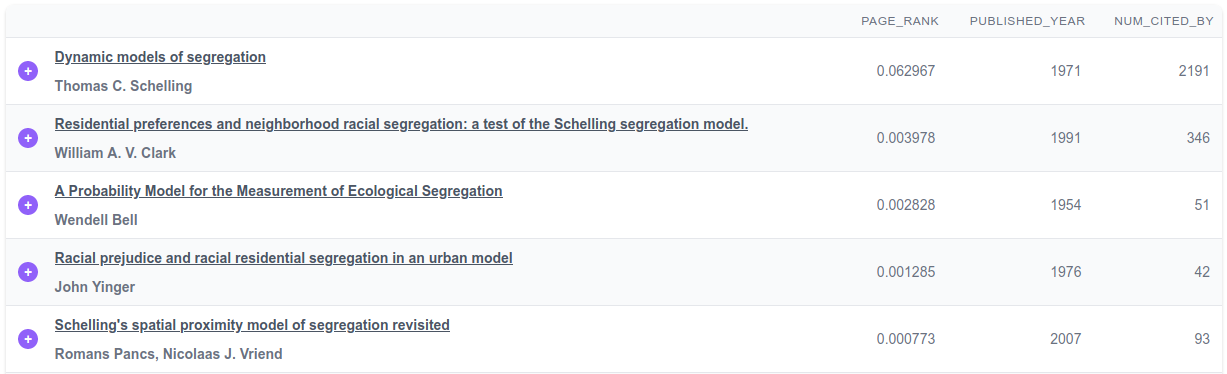
As you can see from the above image in the Important Papers section the most important papers is titled Dynamic models of segregation, so lets use that as a lead and enter segregation models in our keyword filter. This gives us the following in our Important Papers table:
And in the Similar Papers table: 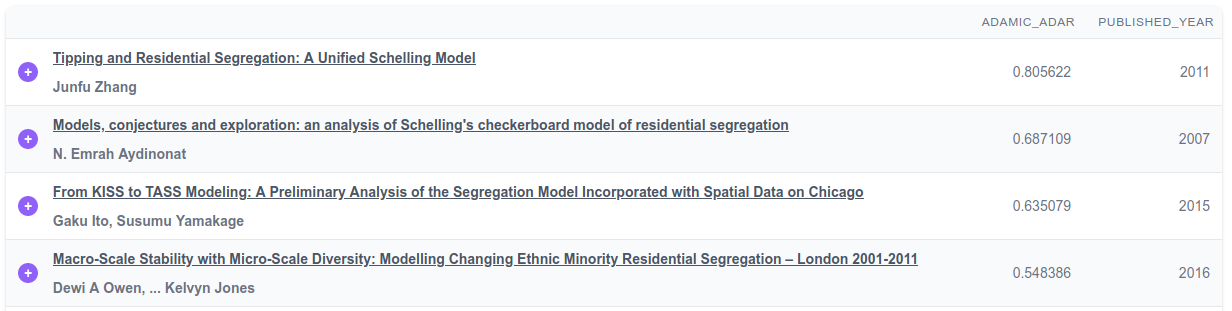
3) Add Relevant Papers
Now that we have a list of papers that are relevant to what we are looking for, we want to start making a new graph centered around these papers. In order to do so, we want to click the  next to each title. This will start collecting papers to add to the graph.
To ensure good results, it is best to add at least five papers which cover your specific topic. Also, be sure to use the paging at the bottom of each table to dig in past the first page.
4) Create the Next Graph
As you add papers a button will pop up on the bottom-right of the screen:

Once you are done adding the papers you are interested in click that button to create a new graph centered around the papers you have chosen. This new graph should be more focused on your topic than your previous one.
In our example we added 7 more papers to the graph. If you are following along, view the updated graph here.
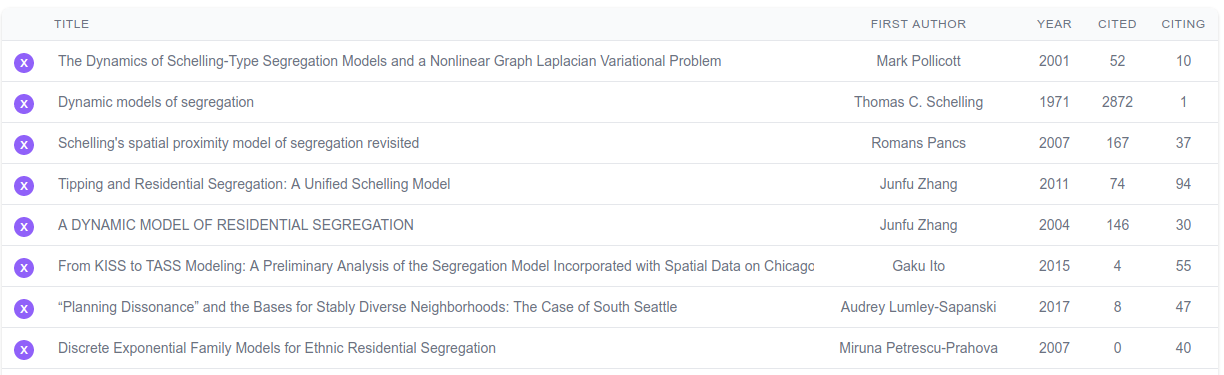
Our new graph uses the following as seed papers:
5) Repeat Steps 3 and 4
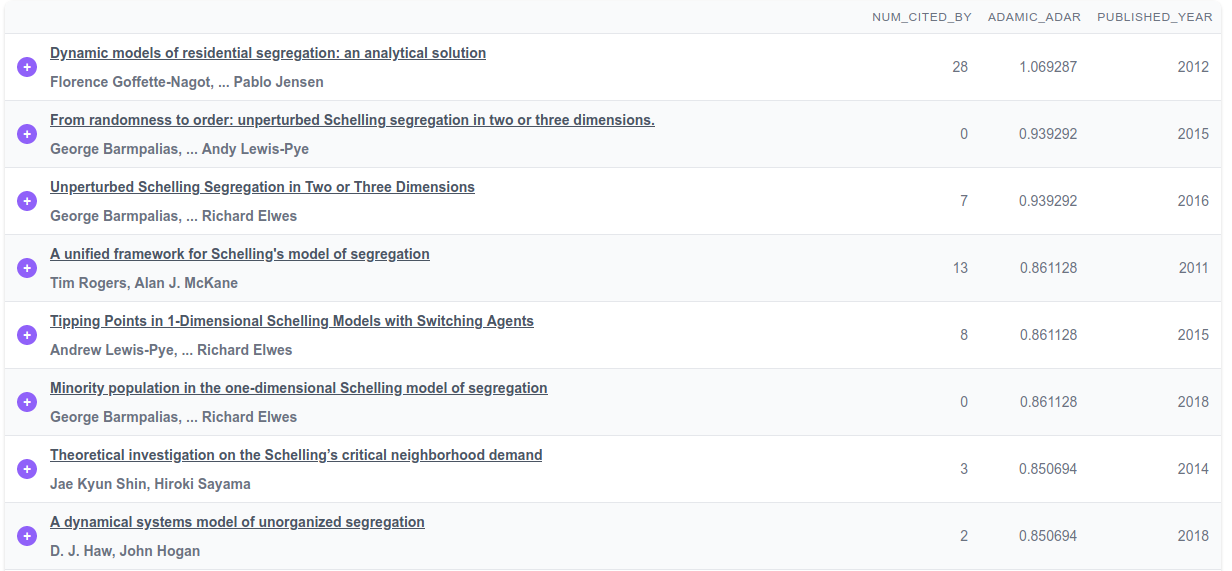
Now that we have built our new graph, we want to take a look at the Similar Papers table again. For us it looks like this and is much more targeted to what we are looking for:
So let’s add a few more papers that look interesting. The top papers tend to focus on the “Schelling Model”, which makes sense because we started with that paper, but we also want to make sure we capture other ideas by looking beyond the first page of the table.
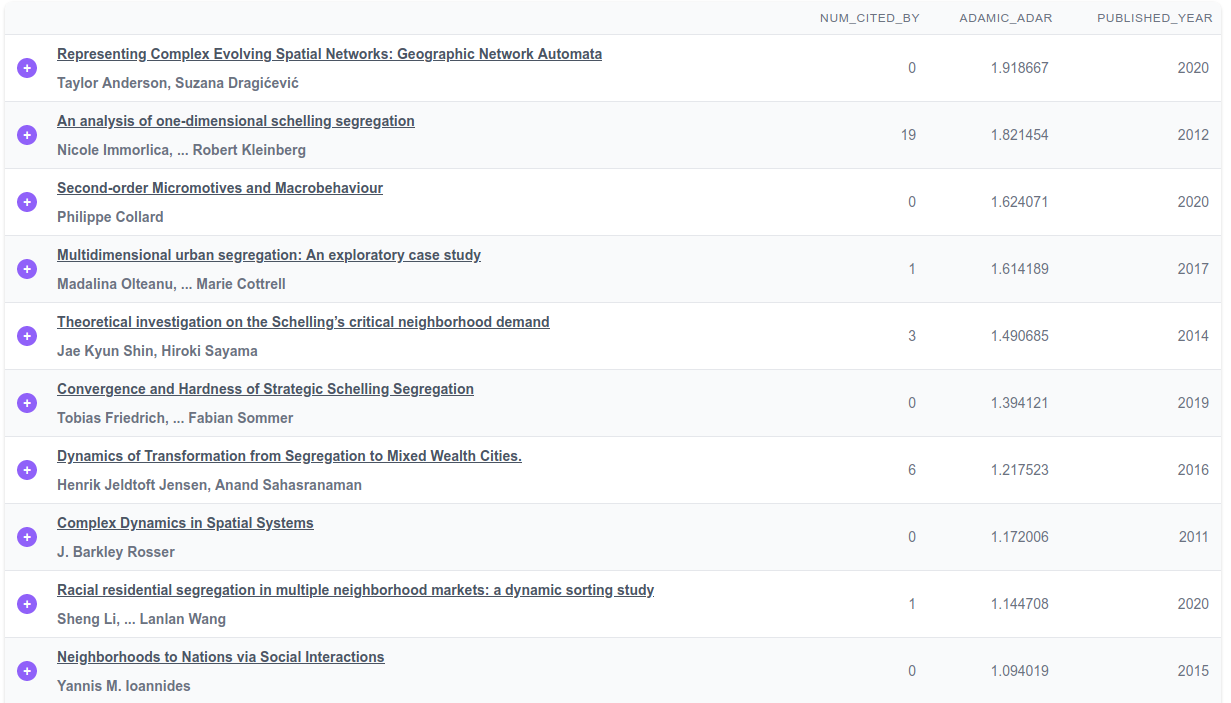
Our next graph added eleven more papers and as you can see the subsequent Similar Papers table starts to focus on the newer literature:
We’ll add a few more interesting papers and then call it a day. Often people find themselves with 20-40 different papers.
6) Review the Results
We’ve stopped with this graph and now we can see what it has to tell us. To start, let’s focus in on the latest papers published in the space by filtering to only papers published after 2015.
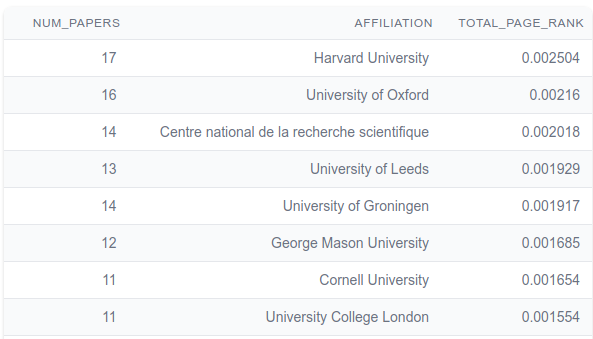
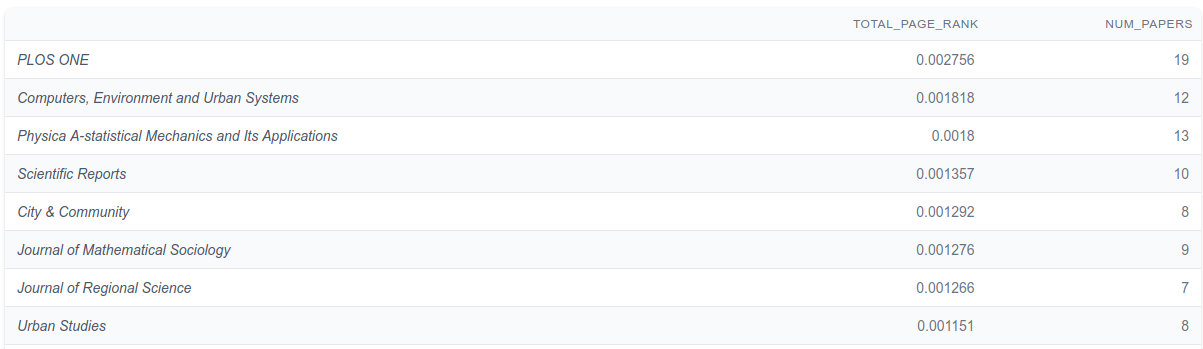
Next we can jump down to the Other Data section to see who is publishing, where they work, and where they are publishing.
It’s easy to see the top authors:
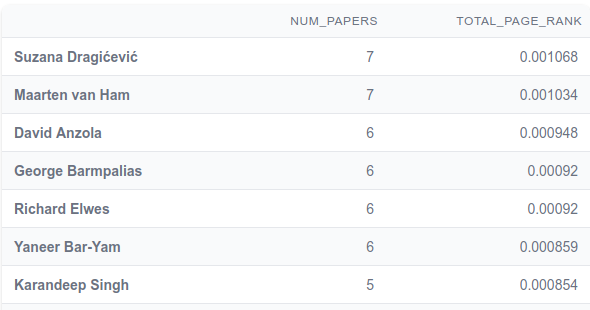
Where they work:
And where they are publishing:
7) Download Your Papers
Now that we have found the papers in which we are most interested, we can easily download the results in a BibTeX format by clicking the link that looks like this  at the bottom of the table. From there you can import it into your reference management tool of choice like Zotero or Mendeley.
Literature Connector
This tool is intended to be used by people trying to bridge two different topics. It utilizes the incredibly fast database originally built for the Paper Discovery tool. This allows us to scan the academic graph to find the shortest paths between two papers faster than any other service. The intention is that you use this to find relevant papers which connect your two ideas and you subsequently add those to the Paper Discover tool as you go using the button next to each paper.
1) Start with Two Papers
To get started, it helps to have two different papers you want to connect in mind. You can either use the search boxes to type in the title or enter the DOI of the paper if you can’t find it through the search. For this example, in order to showcase the power of the tool, we will attempt to connect two papers written by two people very close to me but with very different research interests:
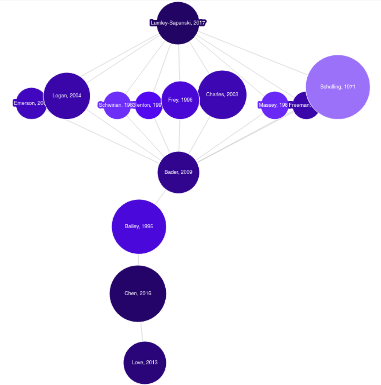
Lumley-Sapanski, 2017 <=> Love, 2013
2) Explore the Results
At the top of the page we have the two papers which were selected. By using the pencil button on the top right of each paper info section, you can change which papers you are searching for.
Next you have some statistics about the search that was performed and the paths that were found.

The search found 288 paths of degree 5 which travel through 331 papers and searched through ~676k papers in the process. For more info on what all of these mean head over to the Literature Connector Explained page.
Path Visualization
Below the stats you see the graph of all of the shortest paths. The size of each of the nodes in the graph is proportionate to the number of paths that pass through that node. So the larger the node, the more central it is to the graph.
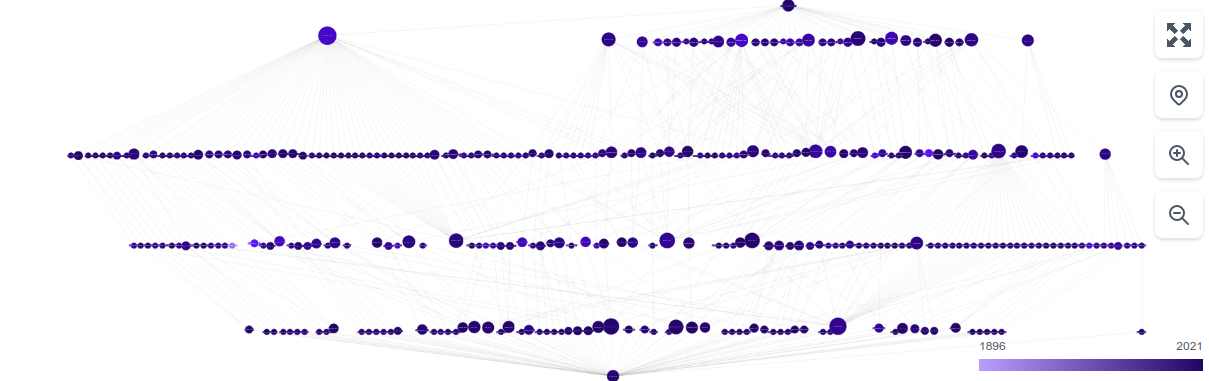
Each of the nodes in the graph is interactive and allows you to learn more about the papers by clicking on them.
You can also enter full screen mode by using the button on the top right. This gives you the best interplay between the table below the graph and the graph.
The Papers
Below the graph is a table with a set of filters. This table allows you to see the papers present in the graph is a more easily digestible format. Using the filters, you can reduce the table to focus on just the papers in which you are most interested. The graph above will reflect your choices by graying out the papers which have been filtered. This allows for a quicker visual understanding of how the different topics/papers are clustered.
Locking Papers
Sometimes the graph is just too big to digest, as it is in this case. For those instances we’ve created a “locking” mechanism. This allows you to lock the graph to a paper of your choice. By doing this the graph will only render the paths which travel through the locked paper. By using the locking functionality, the complex graph from above was reduced to the following:
Since not all graphs are created equal, we’ve tried to give you a number of different ways of paring down the graph to make it useful. If you have any other ideas, let us know.
3) Add Relevant Papers
There are a few problems with the shortest path approach:
- There are always other relevant papers that are not on the “shortest path”
- Often times there will be multiple paths from the source to the destination
- Not all paths will be relevant to your interests.
To remedy this, you will need to use the tools above to find the paths that are most relevant to you. From there, add the papers along those paths to a new search in the Paper Discovery tool, and you should find the other relevant papers which were not along the “shortest path”.
In order to add papers, we want to click the next to each title. This will start collecting papers to add to a the search. You can also click on the nodes in the graph and use the “Add to Lit Review” button to do the same thing. To ensure good results, it is best to add at least five papers which cover your specific topic.
4) Create the Graph
As you add papers a button will pop up on the bottom-right of the screen:
Once you are done adding the papers you are interested in click that button to create a Paper Discovery graph centered around the papers you have chosen. This new graph should be focused on your topic and present you with other papers which are relevant to your search.
Next Steps
If you want to learn more you can head over to the Use Cases section of the docs to see other ways to use Inciteful. If you are wondering about how the site works, head over Paper Discovery Explained or Literature Connector Explained.